1. Private equity is NOT venture capital.
Whilst VC is a subset of private equity, private equity typically refers to investments in well established, significant businesses.
Yes, venture capital is a FORM of private equity. But just because a thumb is a finger, does not mean all fingers are thumbs.
Think buy-outs, distressed asset special situations, growth equity.
2. Private Equity managers are NOT passive investors.
Unlike public equity, private equity managers take an active and strategic role in the companies they invest in. They are far more in control of the directions and destinies of the companies in which they invest.
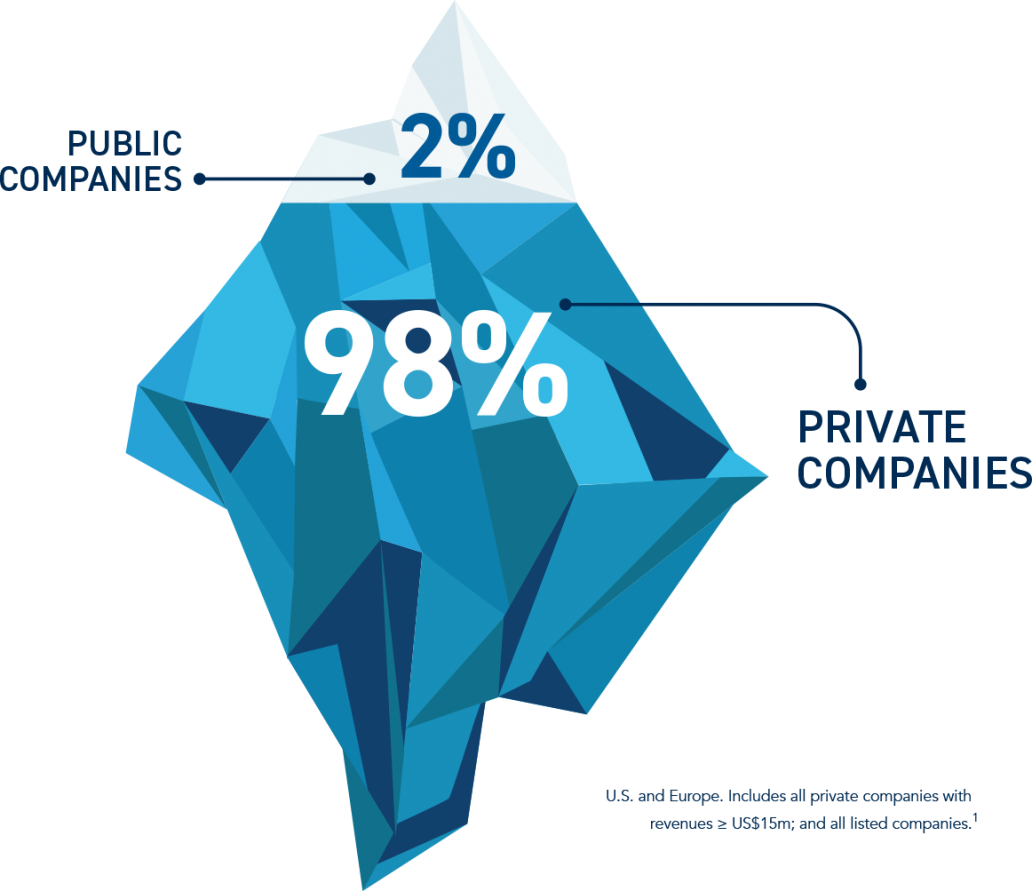
3. Public companies are just the tip of the iceberg. The size of the private market is massive.
If you take number of privately held companies in the US and EU with over $15m in revenues, and add the number of all listed companies… Private Companies account for 98% of investable businesses1, but the access point to invest with the best of these private companies is next to impossible without a high-quality Private Equity manager.
4. Public markets are shrinking.
The number of listed companies is declining, whilst allocation to private equity investments is growing.
The number of listed companies in the us has dropped to less than half of what it was in 1996, whilst the size of global private market investments has grown by about 700% since the year 2000. 1

5. Private Equity is a real asset.
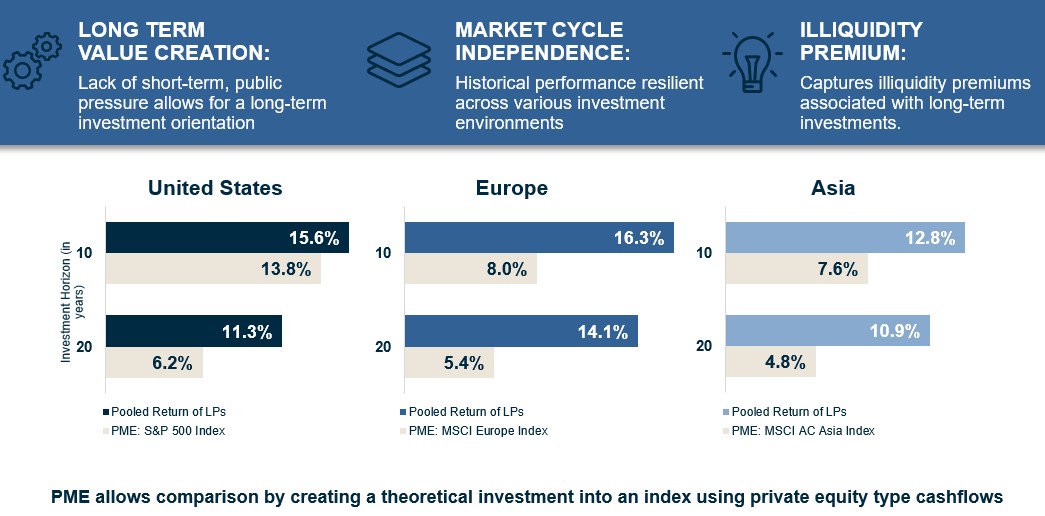
Private markets have outperformed public markets across 10 and 20 year time horizons, across multiple geographies such as US, UK, China.2

6. Private Equity has only really been available to major institutional investors.
Typical PE investment funds require minimum 5-10 million-dollar commitments.
This means that to build a diversified portfolio of PE investments one would likely need 10s of millions of dollars to allocate to PE within their portfolio.
7. Typical Private Equity investments require a 10-15 year lock up.
So not only do you need 10s of millions to invest in PE, you also need to be able to defer investment returns for 10-15 years.
8. Most top quartile Private Equity managers do not need new investors.
The dispersion between top and bottom quartile private equity manager returns can be as large as up to 20%. (Whilst the difference in performance of listed equity managers is much smaller, likely around the 6% mark).
9. The average Australian investor is underweight Private Equity in comparison with the large institutional investors.
Given it’s characteristics for higher returns and lower volatility, the average Australian investor is extremely underweight PE in their portfolios (compared to the future fund’s 14.1% allocation.)3
10. There is a product on the Australian market that is completely changing the barriers of access to private equity.
ASX: PE1
A Listed Investment Trust for private equity is not dissimilar to a real estate trust that takes a typically large and illiquid asset and breaks it up into investable chunks on the stock exchange, PE1 represents an underlying portfolio of diversified global private market investments, managed by one of the largest and most established private market allocators in the world, Grosvenor Capital Management, in partnership with Australian fund management business Pengana Capital.
WANT TO LEARN MORE?
.png?width=400&height=400&name=Charity%20ZDVO%20post%20(1).png)
WANT MONTHLY UPDATES?
- Sources: S&P Capital IQ (utilising certain information obtained from its database) for public and private company data as of 2 January 2020. Includes all private companies with revenues ≥ US$15 million. The World Bank, https://data.worldbank.org/indicator/cm.mkt.ldom.no, for historical listed company data (31 December 1996 for the U.S.; 31 December 2001 for Europe). Neither S&P Capital IQ nor the World Bank has provided consent to the inclusion of references to their databases and publications or material drawn from the databases and publications.
- Source: The above data was prepared by GCM utilising certain information obtained from the Burgiss Group (“Burgiss”). Burgiss is an independent subscription-based data provider, which calculates and publishes quarterly performance information from cash flows and valuations collected from of a sample of private equity firms worldwide (the “Burgiss Manager Universe”). The Burgiss Manager Universe includes data from 8,772 global private funds. The graphs are based on published 3Q 2019 industry data as of January 2020. “Pooled Return of LPs” represents pooled IRR since inception through to 30 September 2019 for all buyout funds in the Burgiss Manager Universe. United States returns are stated in USD. Europe returns include investments with a focus on the developed world and are stated in EUR. Asia returns include private equity expansion capital investments and are stated in USD. All “Public Market Equivalent” (“PME”) returns were calculated using the Long-Nickels methodology and were obtained from Burgiss. All data shown as net return of Limited Partners ("LPs"). Burgiss sources their data from MSCI, S&P and private equity funds worldwide. GCM uploads data into its system used to prepare the above graphs one-time each quarter, however, the data service may continue to update its information thereafter. Therefore, information in GCM’s system may not always agree with the most current information available from the data service. Additional information available upon request. MSCI makes no express or implied warranties or representations and shall have no liability whatsoever with respect to any MSCI data contained herein. The MSCI data may not be further redistributed or used to create indices or financial products. These graphs are not approved or produced by MSCI. S&P and their third-party information providers do not accept liability for the information and the context from which it is drawn. Burgiss, MSCI and S&P have not provided consent to the inclusion of statements utilising their data. No assurance can be given that any investment will achieve its objectives or avoid losses. Past performance is not necessarily a guide to future performance.
- Sources: Future Fund’s quarterly portfolio update at 31 December 2019 (https://www.futurefund.gov.au/news-room/portfolio-update-at-30-september-2020). The author of this publication has not provided consent to the inclusion of references to this publication and material drawn from this publication.
Pengana Investment Management Limited (ABN 69 063 081 612, AFSL 219 462) (“Pengana”) is the issuer of units in the Pengana Private Equity Trust (ARSN 630 923 643) (“PE1”). A Product Disclosure Statement for PE1 (“PDS”) is available and can be obtained by contacting Pengana on (02) 8524 9900 or from www.pengana.com. A person who is considering investing in PE1 should obtain a copy of the PDS and should consider the PDS carefully and consult with their financial adviser to determine whether PE1 is appropriate for them before deciding whether to invest in, or to continue to hold, units in PE1. This report was prepared by Pengana and does not contain any investment recommendation or investment advice. None of Pengana, Grosvenor Capital Management, L.P., nor any of their related entities, directors, partners or officers guarantees the performance of, or the repayment of capital, or income invested in PE1. An investment in PE1 is subject to investment risk including a possible delay in repayment and loss of income and principal invested. Past performance is not a reliable indicator of future performance, the value of investments can go up and down.
.png?width=1400&name=Copy%20of%20Copy%20of%20PENGANA%20PRIVATE%20EQUITY%20TRUST%20ASX_%20PE1%20ENDFRAME%20(7).png)

